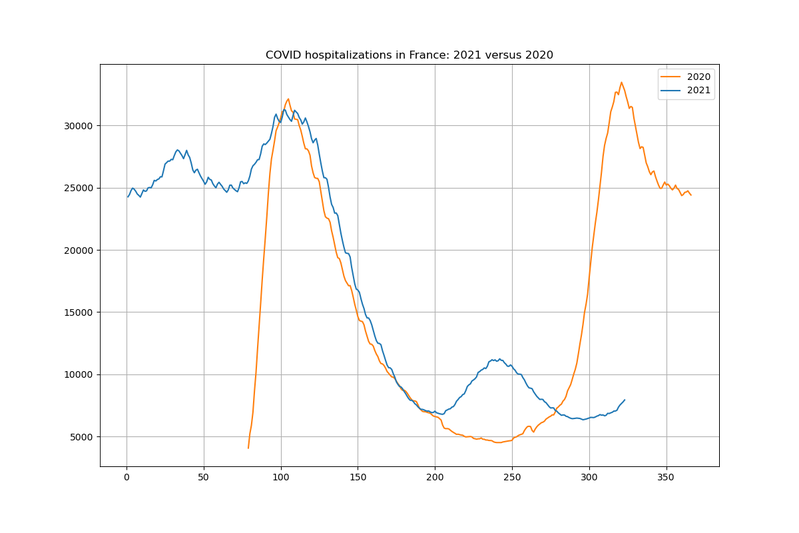
Données des urgences hospitalières et de SOS médecins relatives à l'épidémie de COVID-19
INFORMATION IMPORTANTE Ce jeudi 4 Novembre 2021, le format de la variable sursaud_cl_age_corona sera modifié : Nouveau codage : 0 = "Tous âges" 1 = "0-4 ans" 2 = "5-14 ans" 3 = "15-44 ans" 4 = "45-64 ans" 5 = "65-74 ans" 6 = "75 ans ou plus" Ancien actuel : 0 = "Tous âges" A = "moins de 15ans" B =…
Metadata quality:
Data description filled
Files documented
License filled
Update frequency not set
File formats are open
Temporal coverage not set
Spatial coverage filled
All files are available
Updated 4 days ago
